
An underutilized and easy to access feature on your camera is its histogram. Histograms are those Rorschach-looking blobs on your LCD screen that appear after (and on some model cameras while) taking a photo and provide us with the tonal range of a picture on a scale from 0 to 255 (a value of zero corresponds to data on the far left side of the scale, and has a tonal value of pure black. A value of 255 on the other hand, resides on the far right side of the scale and represents pure white. Each of the 254 values between black and white is a different shade of gray). This is valuable information that can be utilized in numerous ways.
One quick tip after accessing your histogram is to verify that there is no ‘clipping’, meaning that there is not a spike on the far right column on the histogram. A buildup of data here indicates that certain areas of the image are exposed beyond the range of light intensities that your camera can manage (i.e., parts of your photo are “too bright” for your camera to process). Consequently it would be very difficult (if not impossible) to recover this information. If this image were printed, no ink in those clipped areas would be printed on the paper.
An example may help.
Its spring here in Greenville and nature is popping. Danielle (model) and I trekked to Furman to take advantage of the setting sun and the vibrant flora.

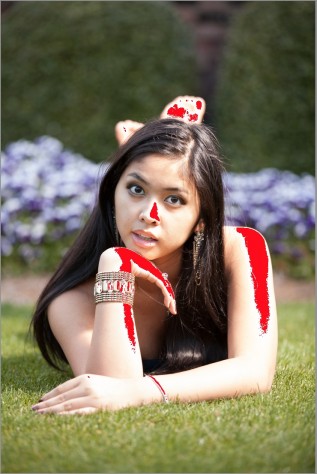
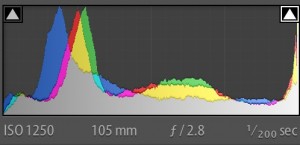
In the above portrait I introduced an off-camera flash (camera right) to emphasize the shadows (hideous lighting, I know, but this is purely for illustrative purposes). Note the overexposed (bright white) areas in the photo of Danielle correspond to clipped data against the far right side of the histogram. To make this easier to comprehend, these blown-out areas in the photo on the right have been colored in red.
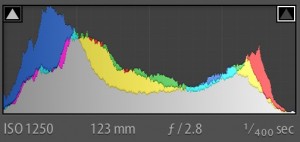
Remedy: While several actions can be taken to rectify the red areas, in the photo below I chose to remove the off camera flash and dial back the exposure by a stop from 1/200 sec to 1/400 sec. Note that there is still a tiny amount of clipped data, apparent in her bracelet. While a overabundance of clipping is not necessarily desirable, sometimes the tonal range of our subject vis-a-vis our camera’s dynamic range (difference between the lightest and darkest values that our camera can capture) may make it impossible to avoid blown-out areas altogether (e.g., shooting the sun in certain situations, or other objects of extremely high contrast in relation to the rest of the photo).

Lesson learned – when trying to reduce the hot spots in a photograph, consider cutting down the exposure. Other remedies include working with an aperture of a higher f stop (smaller opening), introducing a polarizer, decreasing your ISO, trying a different meter setting (spot vs. matrix), using a neutral density filter, and / or modifying your light source.